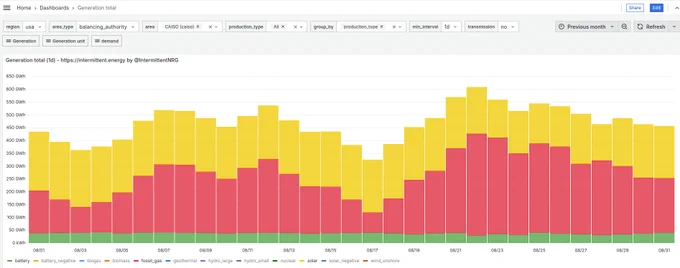
In a different perspective when looking at energy (GWh) instead of power (MW) batteries🟢 5% of total of demand in Aug. fossil gas🔴 34% and solar🟡 29% (some of which went to batteries) From my Generation total dashboard intermittent.energy/d/ddj485…
Batteries and solar are fast becoming the backbone of a clean, flexible power system🔋☀️ In our #GER2025, we saw California batteries supplied ~20% of evening peak demand in June 2024, displacing gas. Fast forward to today: they’re now averaging 28%⚡ ember-energy.org/latest-insi…

Sep 1, 2025 · 11:13 AM UTC

4
4
2
29
Whole graph with all CAISO fuel sources Should maybe improve it a bit, use better colors etc.
2
3
Replying to @IntermittentNRG
Some of that solar, along with some wind was exported so did not supply demand.
1
2
Yea just realized this too. Should've said of total output/supply. There's no demand data in this graph.
1
Replying to @IntermittentNRG
Batteries can provide ~5 % of the energy and at the same time suppy ~20% of evening peak demand.
1
1
I think it's important to look at data from multiple perspectives. Batteries are mostly measured in power (MW) not energy (GWh). Batteries displace peaker plants more than gas plants. The backbone needs to rest at night.
1
1
Yes I get the 5 minute data direct from CAISO caiso.com/todays-outlook/sup… Displayed here as daily total.