
Joined April 2018
- Tweets 8
- Following 5
- Followers 1
- Likes 8

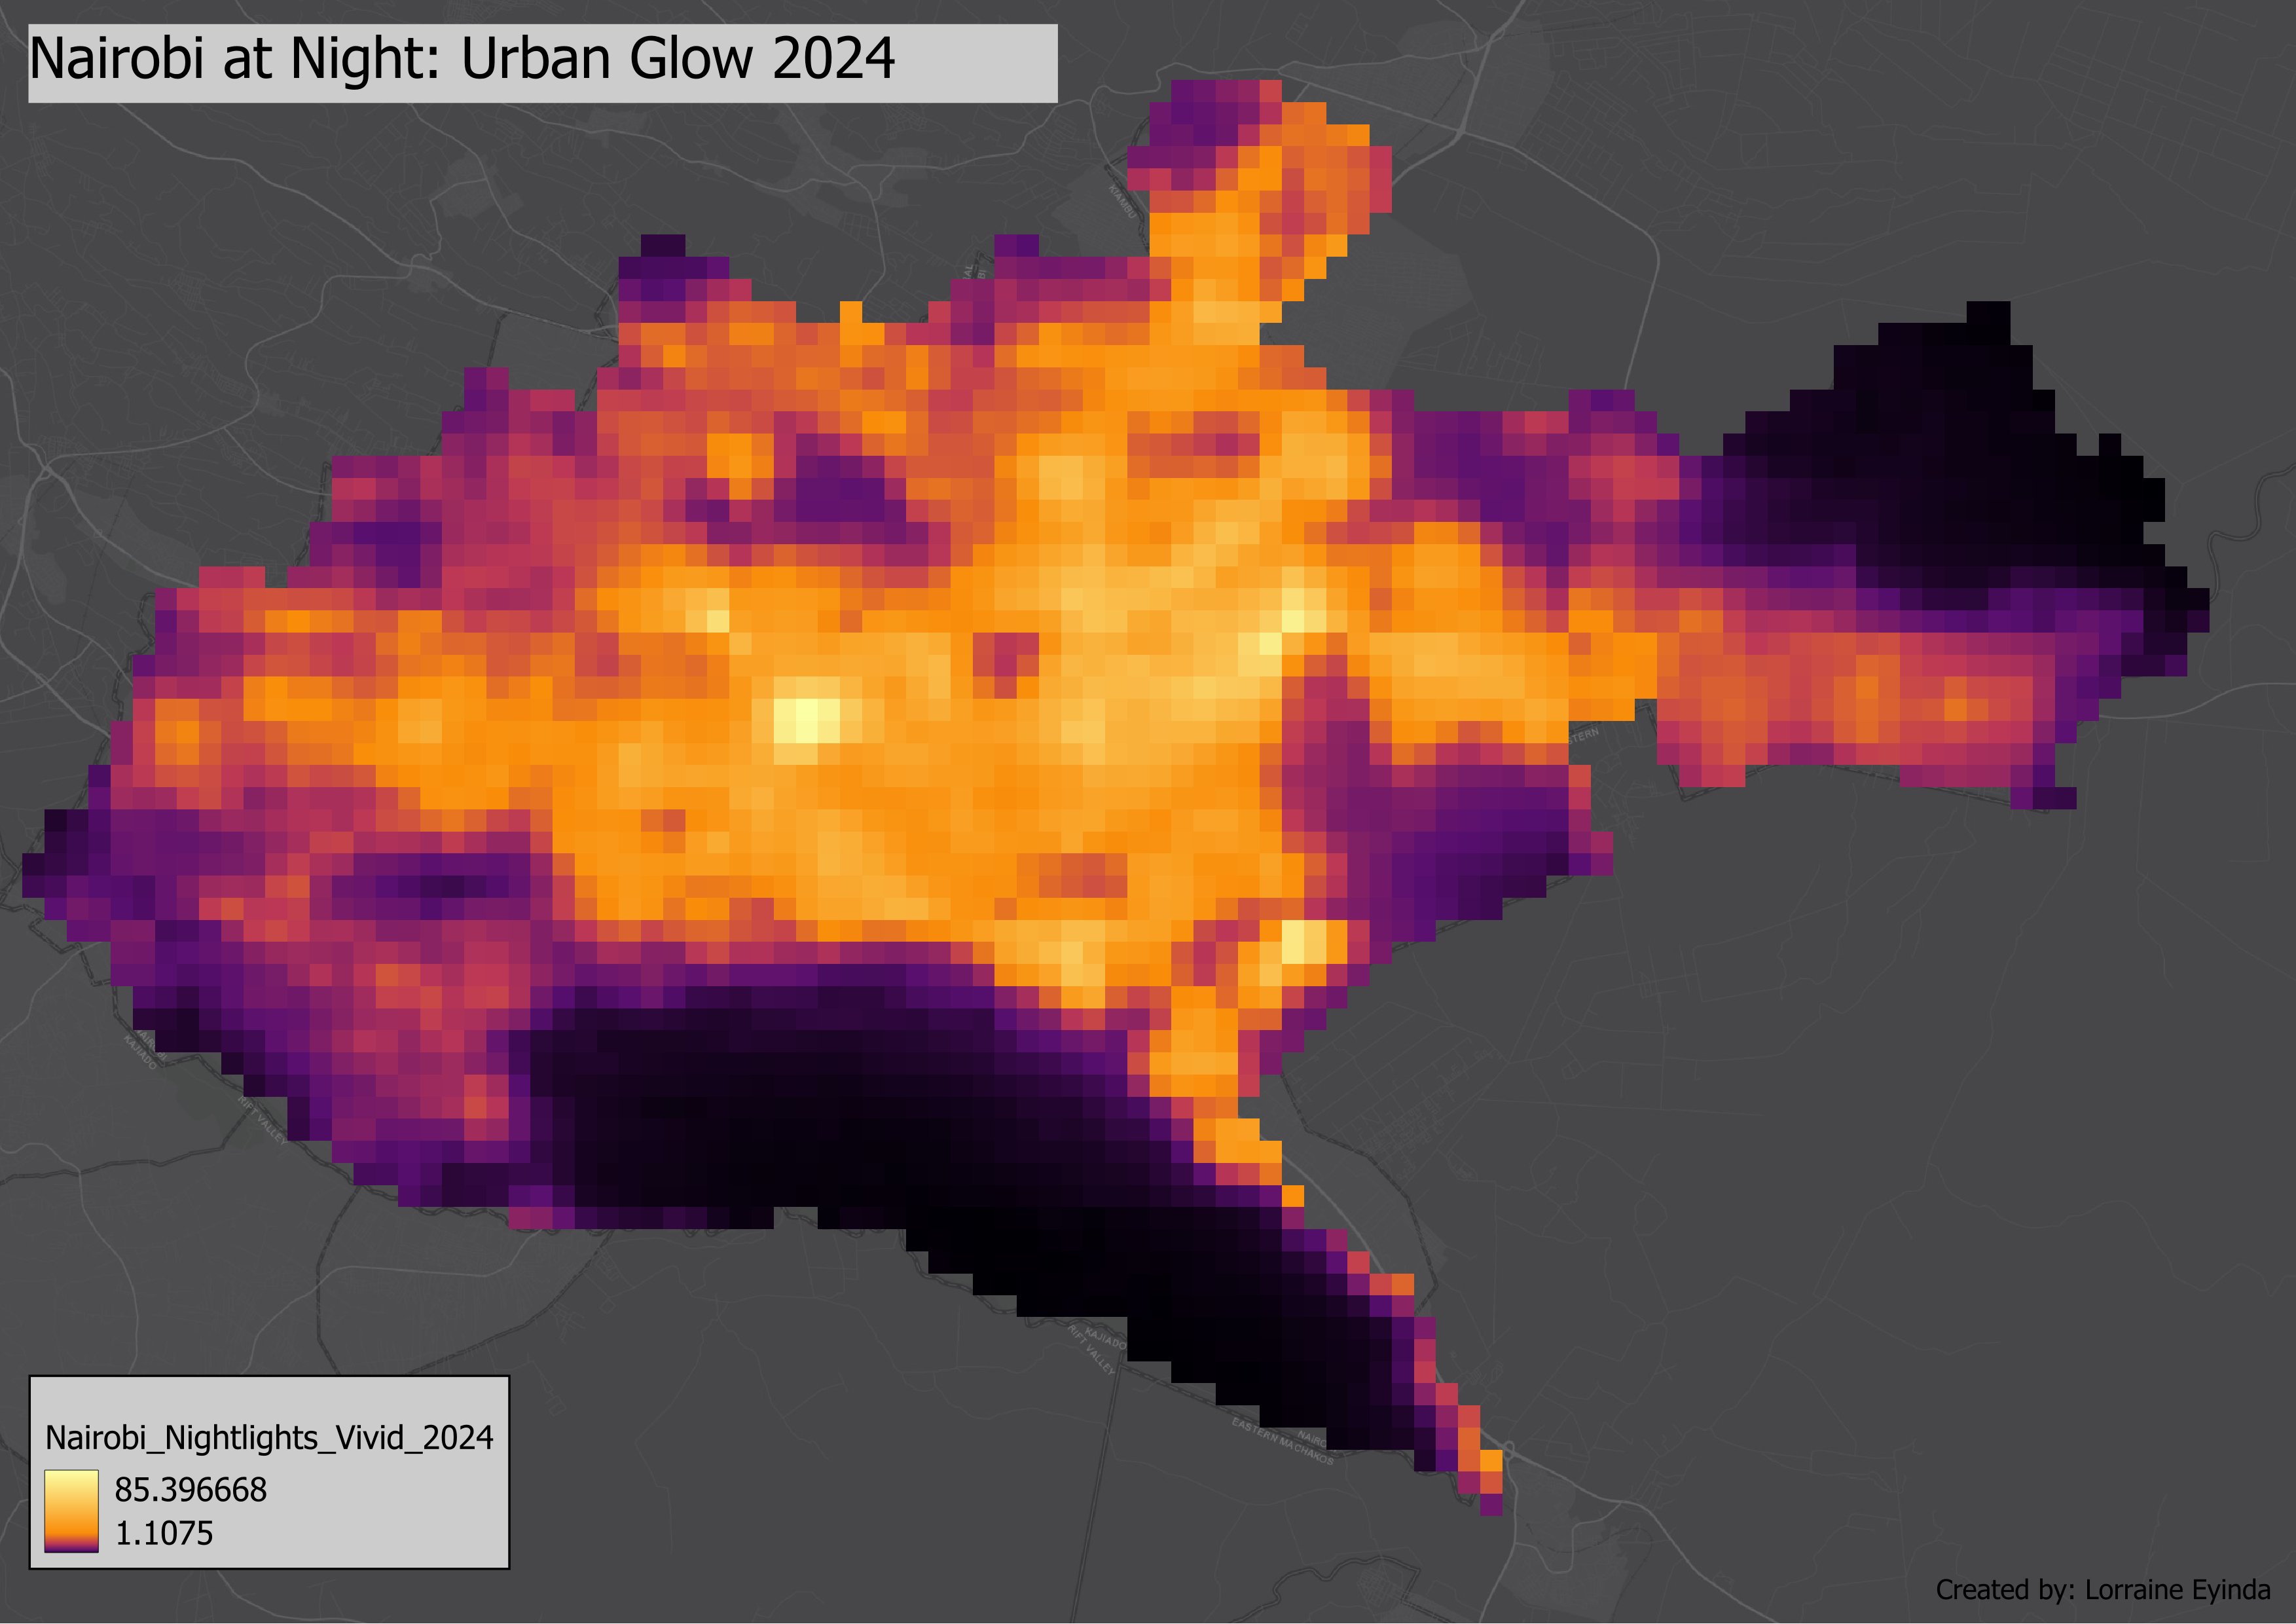
🌃#30DayMapChallenge Day 8 – Urban
Urban Night Lights of Nairobi, Kenya 🇰🇪
Data: NOAA VIIRS 2024 | Tools: GEE & QGIS
#GIS #QGIS #Geospatial #Kenya #NightLights #WorldUrbanismDay
🚗 #30DayMapChallenge Day 7 – Accessibility
Driving time to Marsabit Referral Hospital, Kenya 🇰🇪
Green = 10 min, Yellow = 20 min, Red = 30 min drive zones.
#GIS #QGIS #Geospatial #Kenya #HealthAccess

#30DayMapChallenge Day 6 – Dimensions 🗺️✨
Exploring Nairobi in 3D! Using DEM data, I visualized the city’s terrain and elevation to go beyond a flat map.
#GIS #QGIS #3DMapping #Nairobi


#30DayMapChallenge — Day 5: Slope of Nairobi
Using Copernicus GLO-30 DEM (30m) + QGIS to explore Nairobi’s terrain.
#GIS #QGIS #RemoteSensing #CopernicusDEM

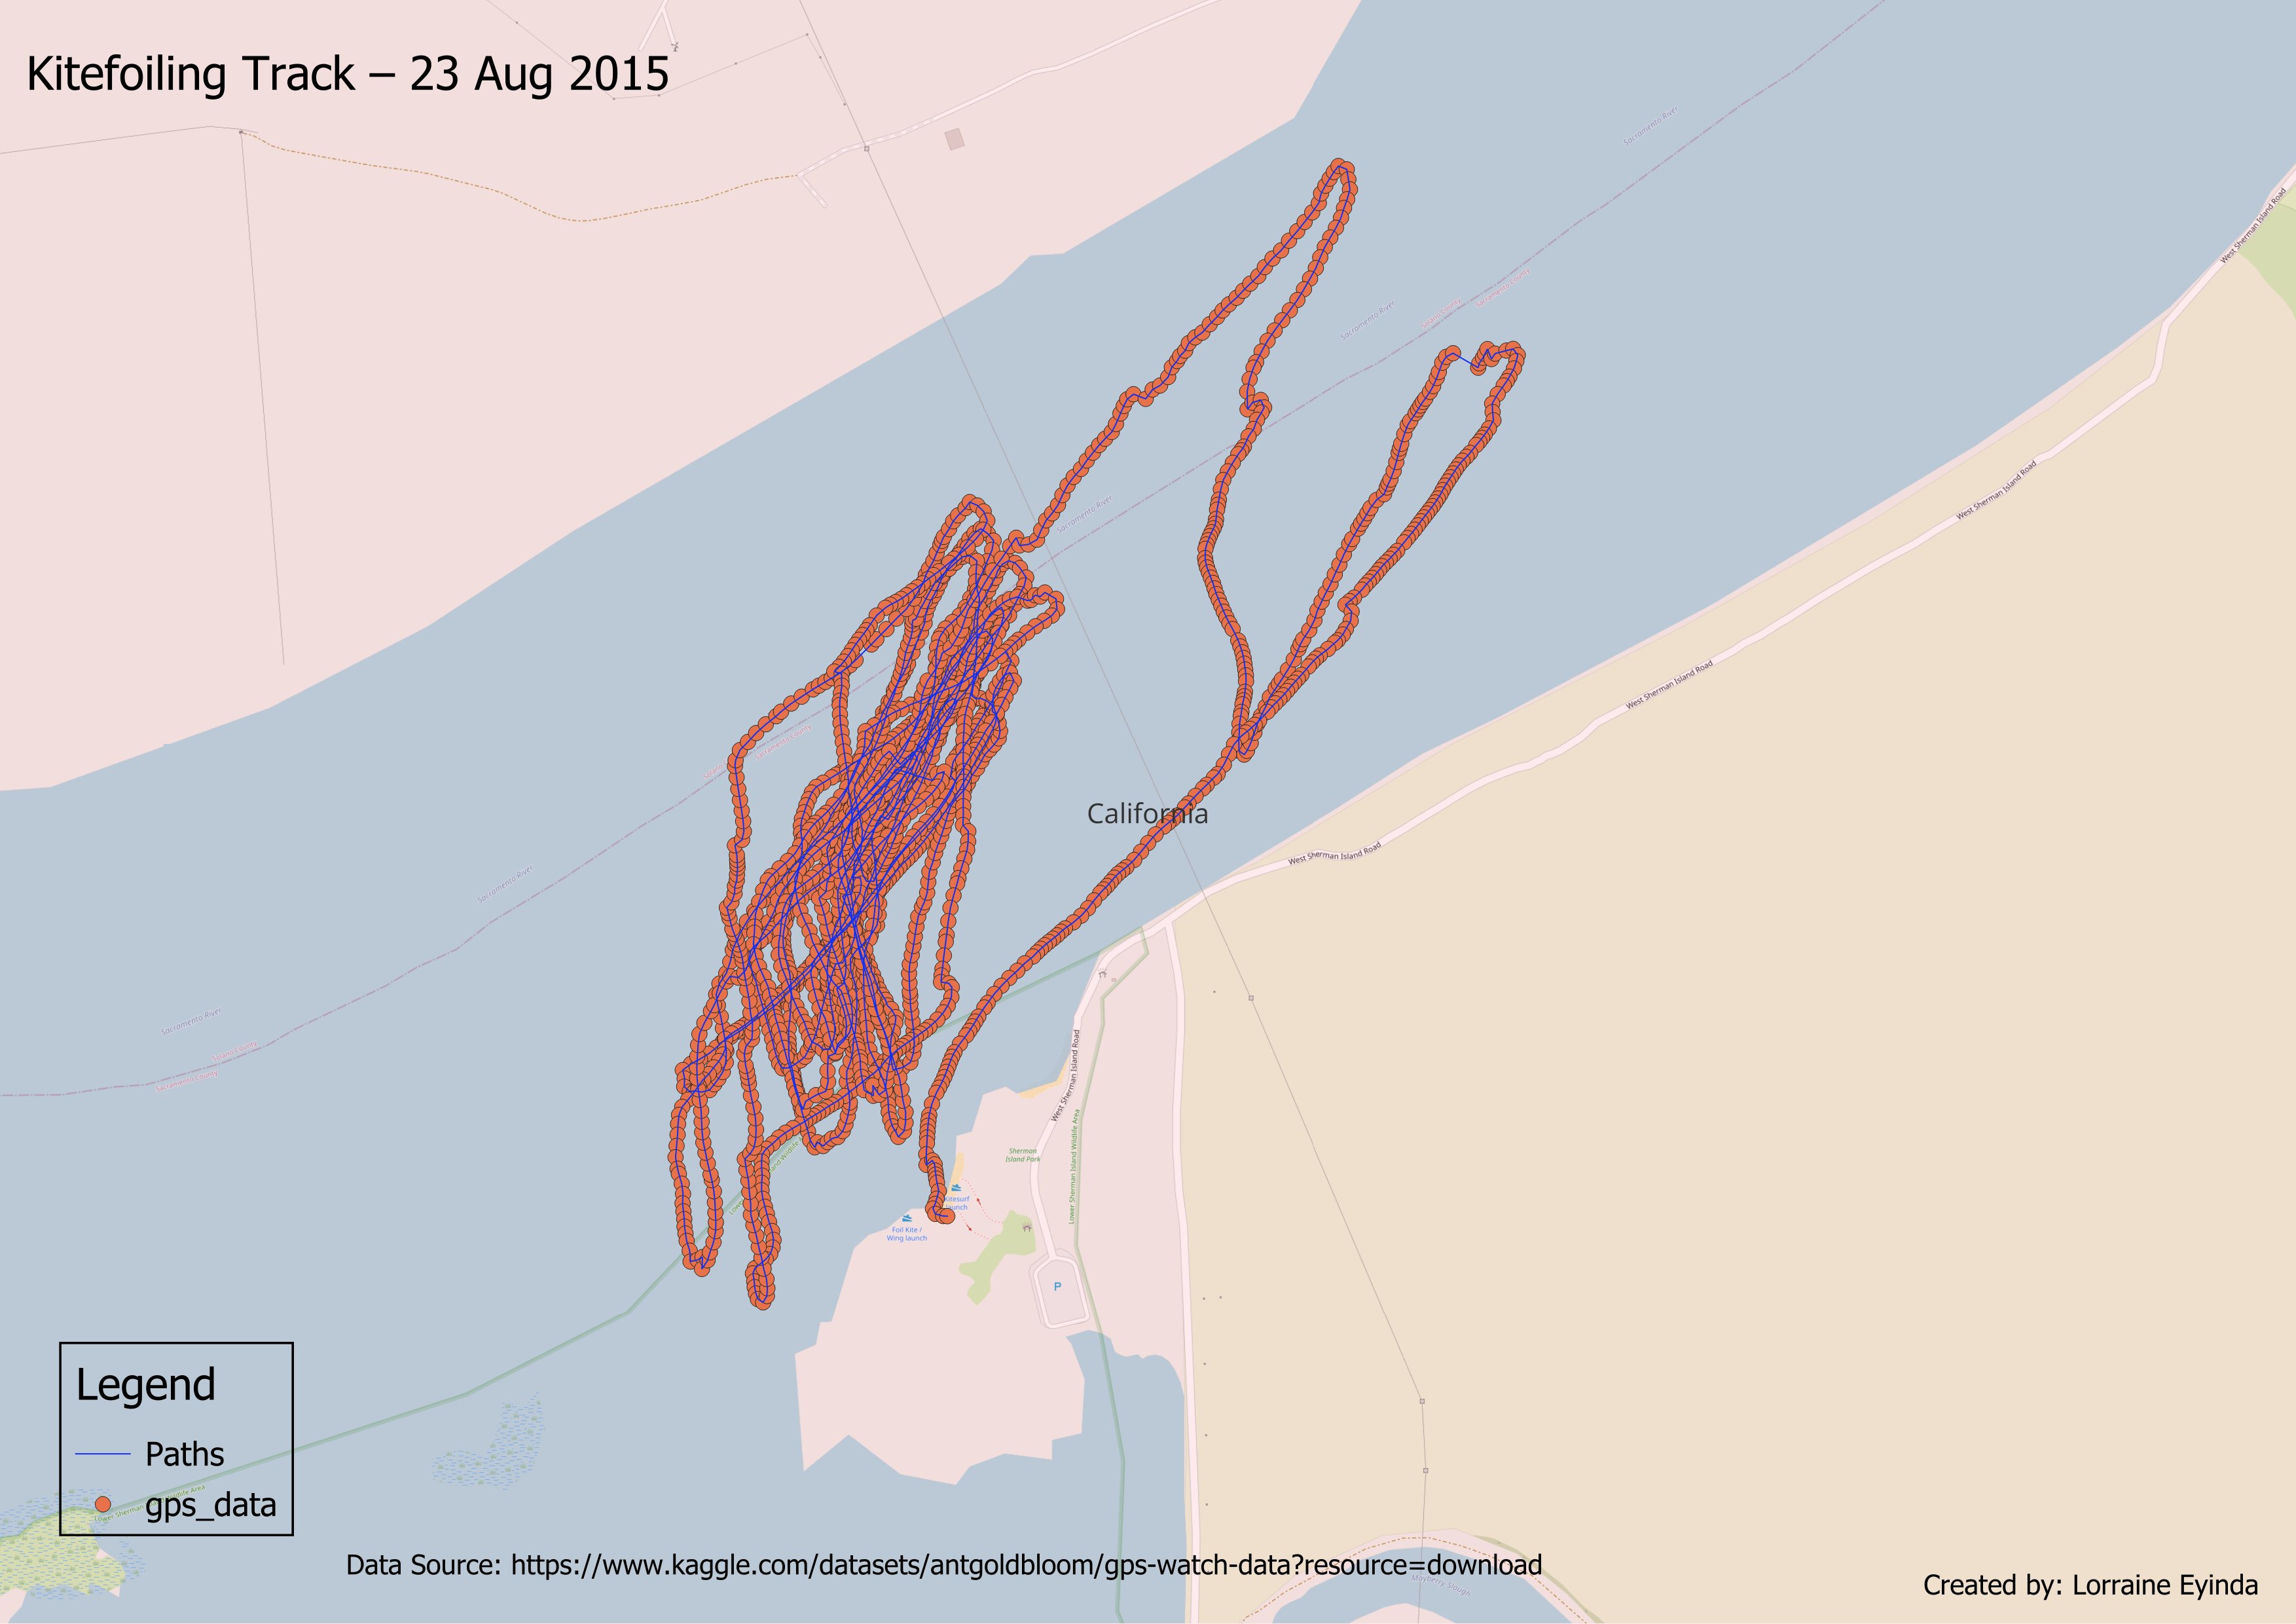
Day 4 – #30DayMapChallenge: My Data
I mapped kitefoiling GPS track 🪁🌊 using data from a watch to visualize the route on the water.
📍 GPS traces only
💡 Sharing so other kitefoilers can explore their own data
#Kitefoiling #GPS #Mapping #DataViz
Day 3: Polygons — #30DayMapChallenge
A choropleth map of population density in Kenya.
Data: Kenya Population via HDX | Processed in QGIS
#GIS #Kenya #Cartography #Population #Geospatial


Day 1 — Points | #30DayMapChallenge
Mapped drought-affected populations across Kenya using proportional point symbols
Point size = number of people affected
Data: HDX (OCHA ROSEA)
Tools: QGIS
SDGs: #SDG13
#GIS #Cartography #Kenya #Geospatial #DataViz #ClimateAction #Drought
